


Have you noticed, how well social media apps have taken over the market?
Don’t Use Social Media to Impress People; Use it to Impact People”- Dave Willis
You might be using at least one social media app, right? That’s the impact of it on users. It not only influences them to use one of such platforms but helps them to find a way to fulfill their needs.
Social media has created a revolution. It has become a way to influence people in a manner that changes their behavior and mindset.
What a power it has!
Well, here we are discussing certain reasons that make it so amazing to shake the lives of people. Market statistics not only helps you to get what’s going on but also to keep an eye on it to optimize the data in your favor.
If you are the one looking to develop a social media app, then it’s the right platform to know about the market. After all, it’s the first step that takes you close to making a dream app.
Let’s begin the journey of market statistics.
Digital Revolution: Social Media Surge
Are you excited to dive into the world of learning social media evolution?
Dear enthusiasts, we are here to help you.
1. Early Beginnings
- It all started in the year 1970- 1995 when the PLATO system offered early forms of social media with notes
- Next comes bulletin Board Systems (BBS) and online communities that have permitted the users to share information over telephone lines.
- Then from 1995 to the 2000s, platforms like classmates.com and Six Degrees were considered the very first social networking sites.
2. Rise of Pioneers
- Later in the year 2002, the platforms including Friendster and MySpace evolved.
- LinkedIn evolved as a platform targeting professionals in the year 2003.
3. Facebook Era
- One of the platforms that has taken an outbreak was Facebook in the year 2004. With its innovative features, it has become a favorite platform in that era.
- YouTube evolved in the year 2005, providing space for users to upload, share, and view videos, giving rise to a new era of content creation.
4. Microblogging and Real-time Communication
- Later on, in 2006, Twitter Introduced microblogging, helping users to post short and real-time updates.
- Visual content was followed in 2010 when Instagram came into existence.
5. Modern Landscape of Diversification
- Now, it was the time for filters and editing that has diversified the scope of social media.
- Platforms like Snapchat and TikTok came into existence in the years 2011- 2016.
- The current era of social media is vast with multiple sites and apps.
Now, as you get a brief about social media surge and information about its history. It’s time to have certain current stats. Proceed to the next section to find it.
Key Takeaways
The past of social media does not have an impact over the present. To develop a social media app, all you need is the present data that will influence the future.
Here are some key takeaways that you will study in detail later.
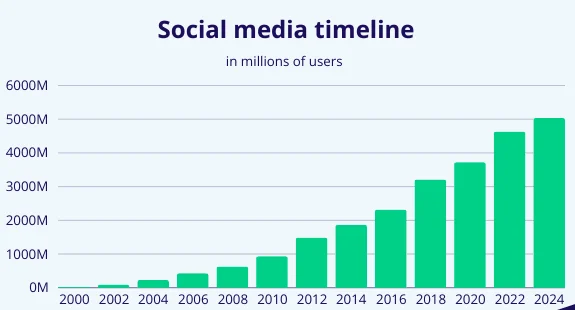
- In 2025, over 5 billion people are using social media, and this number is projected to reach over six billion in 2028.
- The registered number of users of social media platforms like Facebook is 3,065 Million.
- As of April 2024, there are 5.07 billion or 62.6% of the world’s population uses social media platforms.
- The global social media penetration rate is forecasted to increase from 2024 and 2028 by 11.6%.
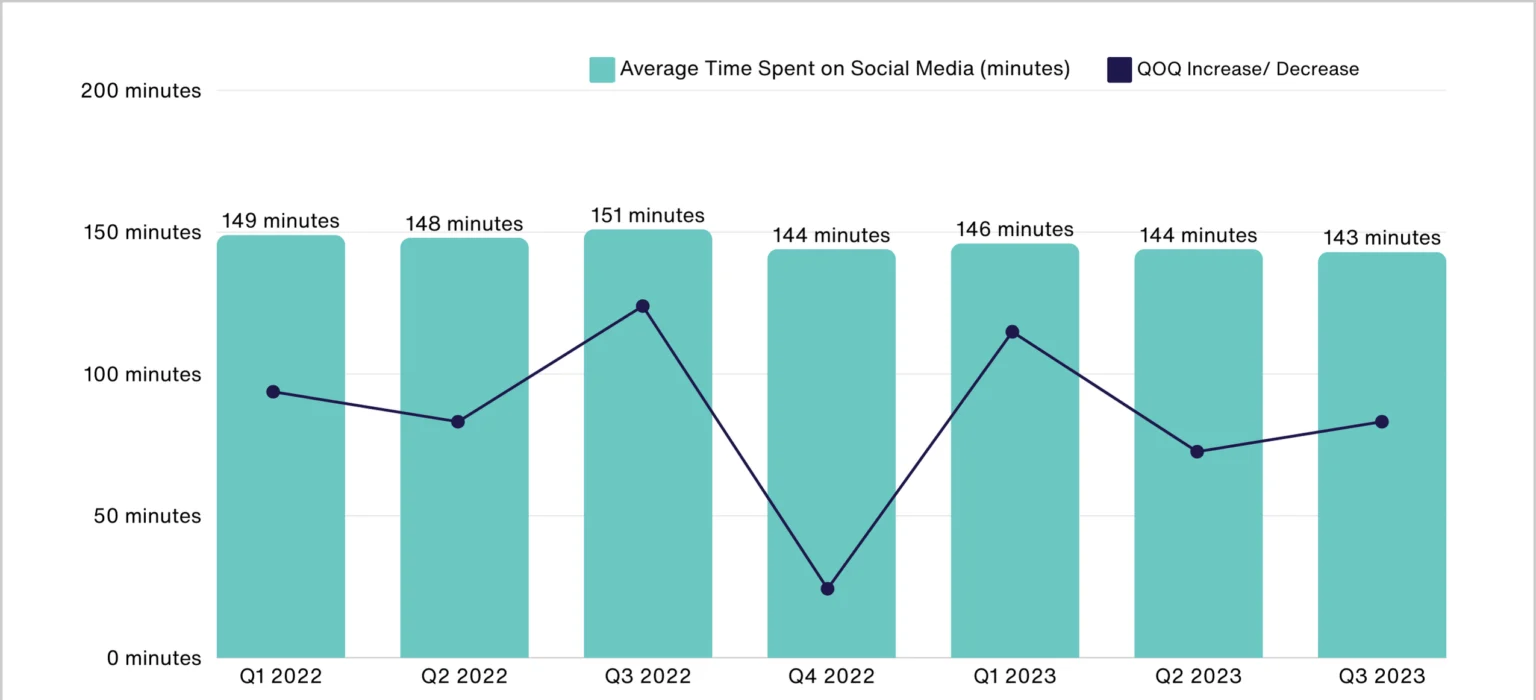
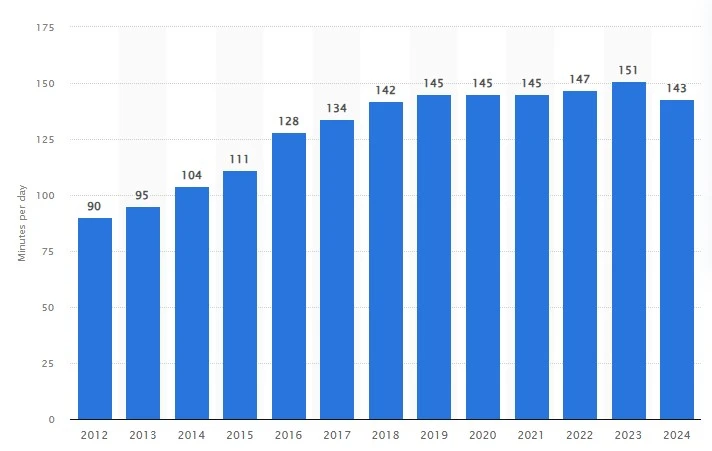
- The daily average time usage worldwide amounts to 143 minutes per day.
- Social media platforms including Facebook, Instagram, and YouTube derived nearly approx. $11 billion through advertising.
- China has the largest number of social media users in the world with over 1.03 billion active users.
- 59% of people reported that social media has impacted their mental health.
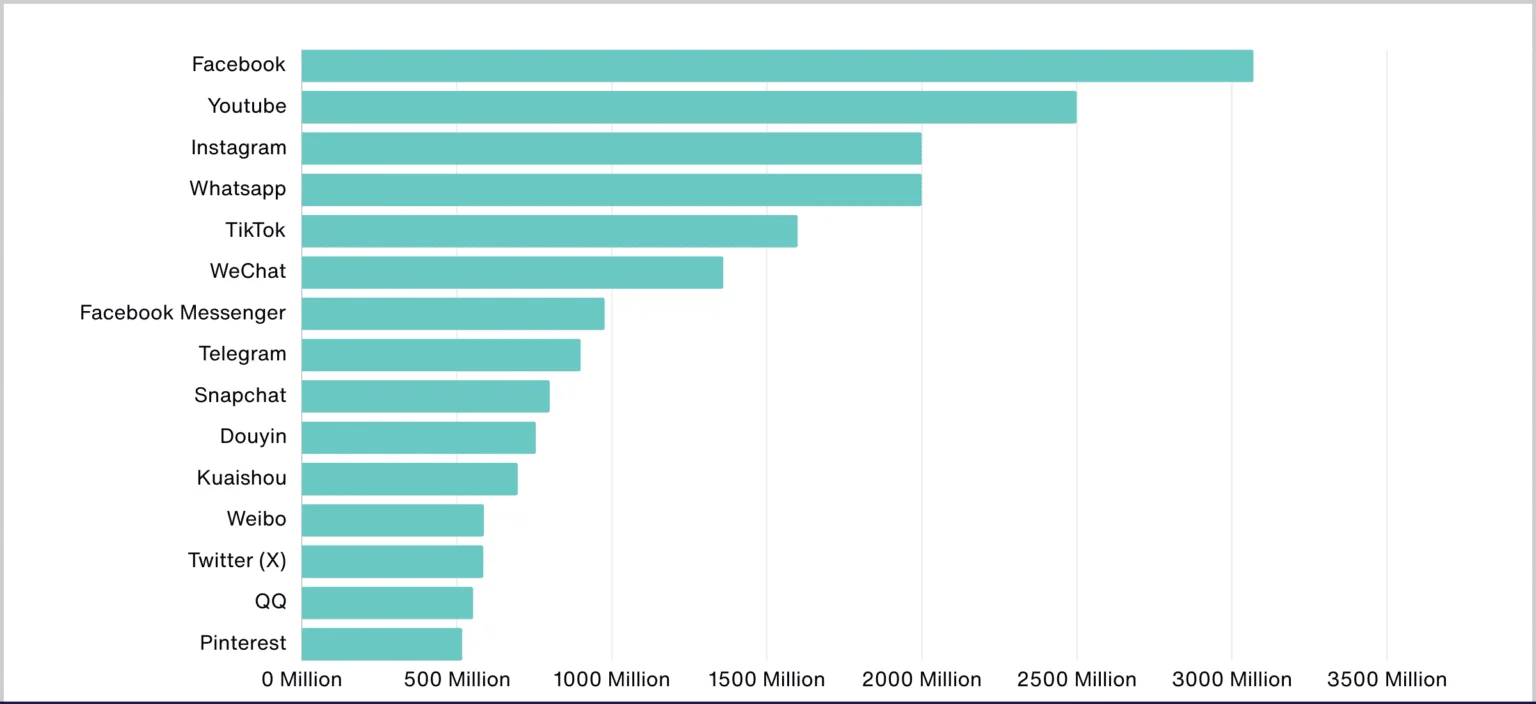
- Facebook has the most users at three billion, which are followed by YouTube and WhatsApp. It has become the most used social networking app in the US, which is followed by Instagram.
- The social media app stats in 2025, reflect not much change, however, since 2021, you can observe a major change in platform usage.
Well, these were the points that you need to take out before making your app dream into reality. We are going to discuss them in detail further.
Worldwide Social Media App Usage Statistics
Learning a brief about social media is like having a half-hand over trying to make your dream app a reality. Let’s learn it whole to know what the market can offer us.
Here is social media user statistics that you can admire for considering your app effective.
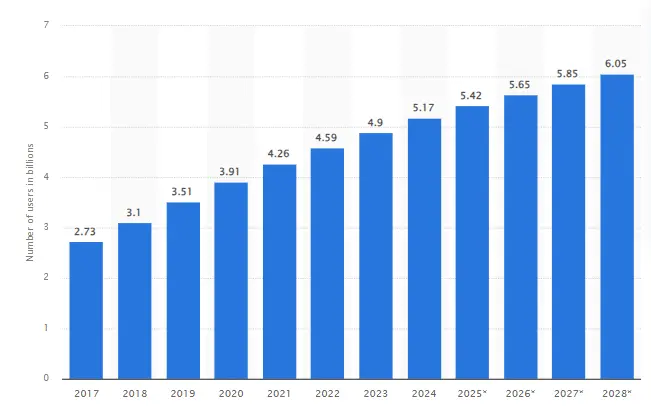
- In 2024, the number of people using social media is over five billion, which is projected to increase to over six billion in 2028.
- Global social media statistics show that in the year 2024, there were 5.44 billion internet users worldwide and a total of 5.07 billion or 62.6% of the world’s population were social media users.
- According to Forbes, there are 5.04 billion social media users in 2024.
- In the year 2023, there were 4.9 billion people using social media across the world.
- However, in the year 2022, the social media market was valued at $49.09 billion worldwide.
Well, after learning the worldwide statistics related to the social media market, we will be discussing the other aspects. Shall we proceed?

Motivation to Use Social Media: Why People Like to Remain on Social Media Most Often?
You have got all the details related to a worldwide market of social media. Now let’s narrow it all down for better understanding.
Here, we will start by learning what makes social media boom among people and to like these apps. Aren’t you eager to know why people use social media apps this much?
Then, here we carry out social media addiction statistics and how it has even become an addiction.
 Here is a list that makes people use social media.
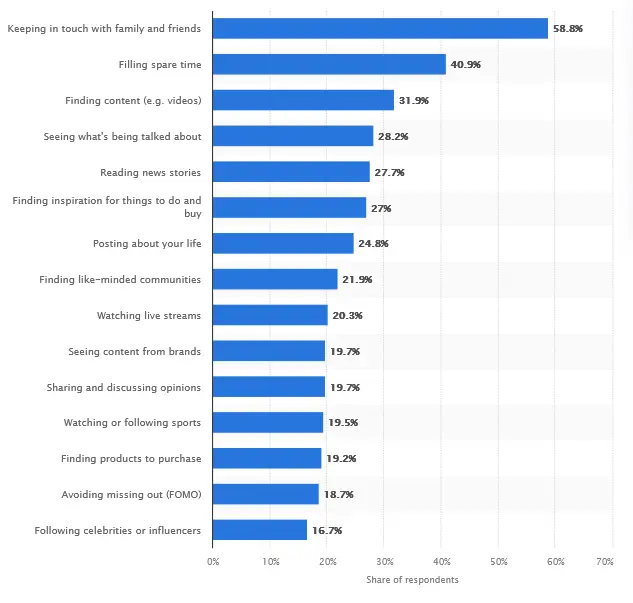
- 58.8% of people stated that social media platforms help them to stay connected with family and friends.
- 40.9% stated that they desire to fill their spare time. 31.9% did it to find content.
- According to social media stats defined by Forbes, social media platforms are designed to enhance sales by 150% compared to solely websites.
- About two-thirds of online adults which is approx. 66% stated that they use social media platforms to keep in touch with their friends and family.
- While 44% stated that users around a shared hobby or interest is one of the major reasons that they use social networking platforms.
- According to a survey, it has been revealed that less than half of social media account holders post content at least occasionally. They are inclined towards browsing rather than posting content.
Now, that you are aware of the social media facts and statistics, it’s time to know a little more. Are you wondering about the current competition in the social media app market? Let’s get into it together.
Social Media App Statistics 2025
Are you bothered about how social media is going to impact the year 2025?
Well, with the growing demand for social media apps, this, year is going to bring a revolution where businesses have vast opportunities to take over the market.
As of today 5.22 billion people globally use social media platforms which is approximately 63.8% of the total global population.
However, China has the most social media users with around 1.07 billion people. Additionally, it has been found that people spend 2 hours and 23 minutes daily on social media platforms which is slightly going to increase in the year 2025.
According to the new york times article in the year 2023, it has been discovered that the paltforms mentioned above are going to increase, in case of downloads and revenue. From the year 2021 to 2025, a slight change in their growth can be examined via numbers.
You can evaluate a slight decrease in the use of platform, isn’t it. However, within the US, the social commerce buyers, by the platform (2019- 2025) is expected to slightly increase from the year 41.3 to 69.4 million.
Top Social Media App Statistics in 2025
After learning global social media stats, are you worried about how top social media apps made it this way?
Well, this answer can be revealed after learning significant social media statistics. Here’s the checkout list.
1] Facebook
- Facebook is among the top-used social media platforms in the current era. It was the first platform that has passed one billion registered accounts and has more than three billion monthly users.
- According to Britannica, Facebook is among the largest social networks with approx. 3 billion users as of 2021 and about half of these people were using the platform almost every day.
- Based on a global survey, 89% were responding social media marketers used the network to promote their business and Facebook was among the most commonly used platforms.
- A number of monthly active users of Facebook as of the 4th quarter of 2023 were 3 billion.
2] Instagram
- Instagram’s growth statistics show that it become the third most preferred app, followed by Facebook and YouTube, with 2000 million monthly active users.
- Based on the data from Kepios, 0.2% of Instagram users are unique to the platform.
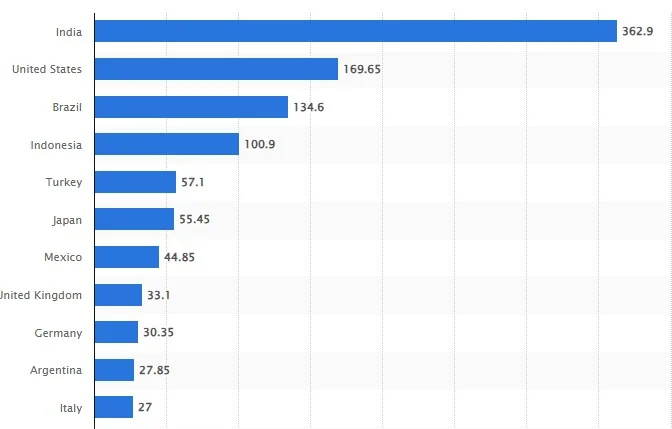
- Regarding Instagram user statistics, India is the top-leaning country with over 362.9 million of people using the platform. The United States and Brazil have 169.65 and 134.6 million users. Is this data enough for you to develop an app like Instagram?
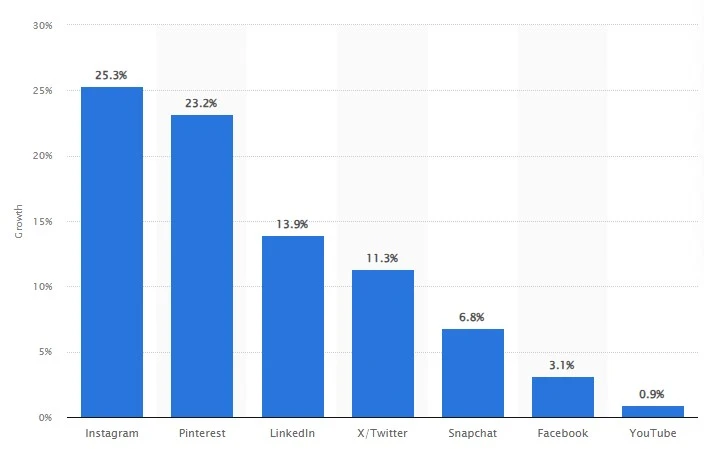
- Year-on-year, Instagram has experienced a high growth among users with about 25.3%.
3] YouTube
- YouTube is considered the second largest platform with 2.5 billion users worldwide.
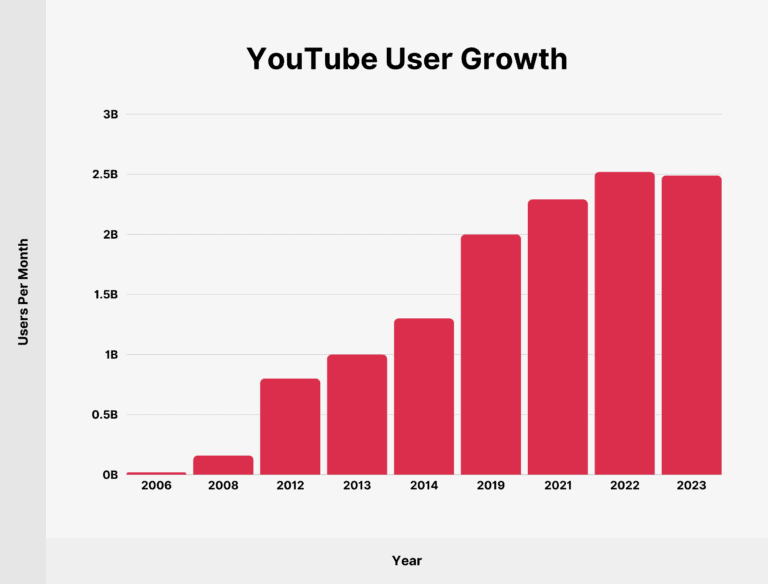
- In 2024, you should note that this social media platform has more than 122 million daily active users which can be a reason to develop an app like YouTube.
- Along with this, YouTube Premium and music together have 100 million plus subscribers in the world.
- Between July to December 2023, the global traffic came from desktop services. On the other hand, 90% of the visits were made through mobile and smartphone devices.
4] LinkedIn Statistics
- The highest number of users on LinkedIn was about 59.1% between the ages 25-34.
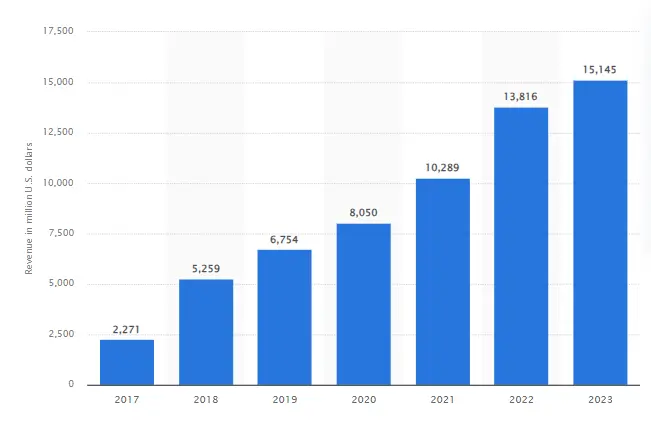
- During 2022, LinkedIn has generated an annual revenue of 13.8 billion U.S dollars.
- In 2022, there were about 571 million global LinkedIn Users and 174 million LinkedIn premium subscribers.
- The global number of users over the platform increase between 2024 and 2028 by in total 171.9 million users.
Bonus Read: Develop an App like ZipRecruiter
5] WhatsApp
- WhatsApp counted roughly 3 billion global users in the year 2025. And two billion monthly active users globally.
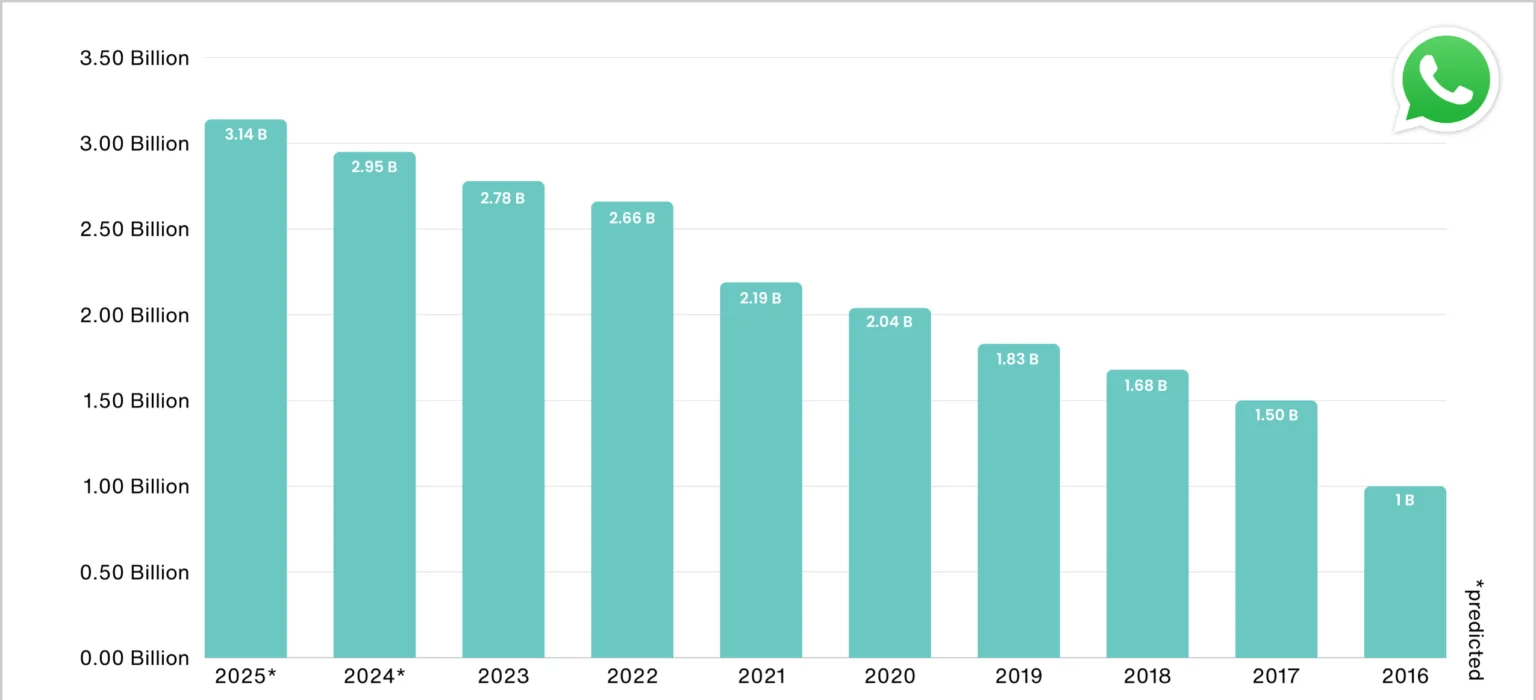
- The platform is used to send more than 100 billion messages each day.
- India has the top 596.6 million WhatsApp monthly active users. The platform is the 8th most downloaded app in the world.
- 70% of the WhatsApp users visit the app every day that can be significant reason to develop an app like WhatsApp.
6] X (Twitter)
- The platform accounted for over 500 million monthly active users in 2024.
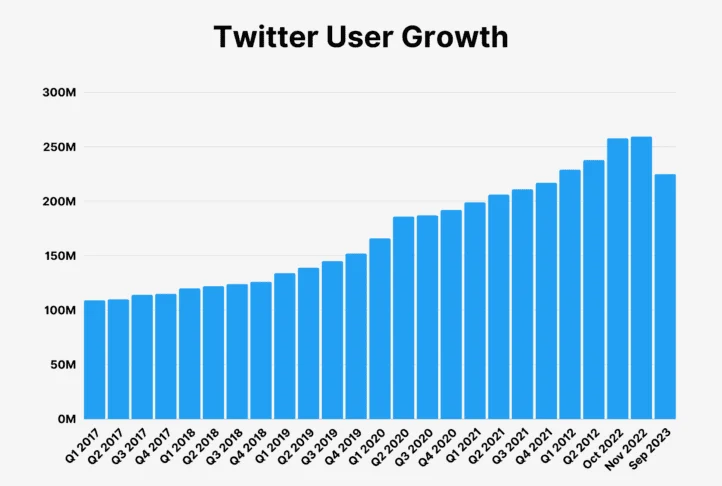
- X generated over 89% of its revenue through advertising services. Along with this, 11% was generated through data licensing.
- In 2023, there are an estimated with over 100 million of these users from the United States
- To make an app like X/Twitter, you should know that the platform has reached to 12.6% of internet users worldwide.
7] Snapchat
- In 2023, Snapchat generated an annual revenue of approx. 4.6 billion U.S. dollars.
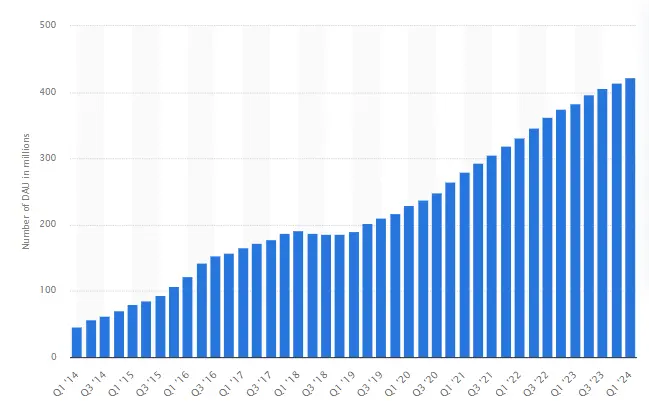
- Based on the first quarter of 2024, photo and video sharing app Snapchat had 422 million daily active users
- In 2021, the photo and social media app Snapchat had approximately 428 million monthly active users
- Over 397 million people use Snapchat daily, with 26% based in the United States. This can be a motivation for you to develop an app like Snapchat.
Here, you get the stats about the top social media users by platform. Now, if you might be wondering how to create an app like Yubo, then you should be finding a way to earn money through these platforms. Head on to the next section related to how social media apps make revenue.
How Social Media Apps Make Revenue?
Till now, you have gathered information related to worldwide social media app statistics. Along with particular social media traffic statistics.
After learning the right way to invest in app development. What can be the significant method to earn money through the platform? Let’s learn a few of them and their related statistics.
- Social media marketing facts revealed that the amount spent on social media advertising market has been expected to reach US $276.72 billion in 2025.
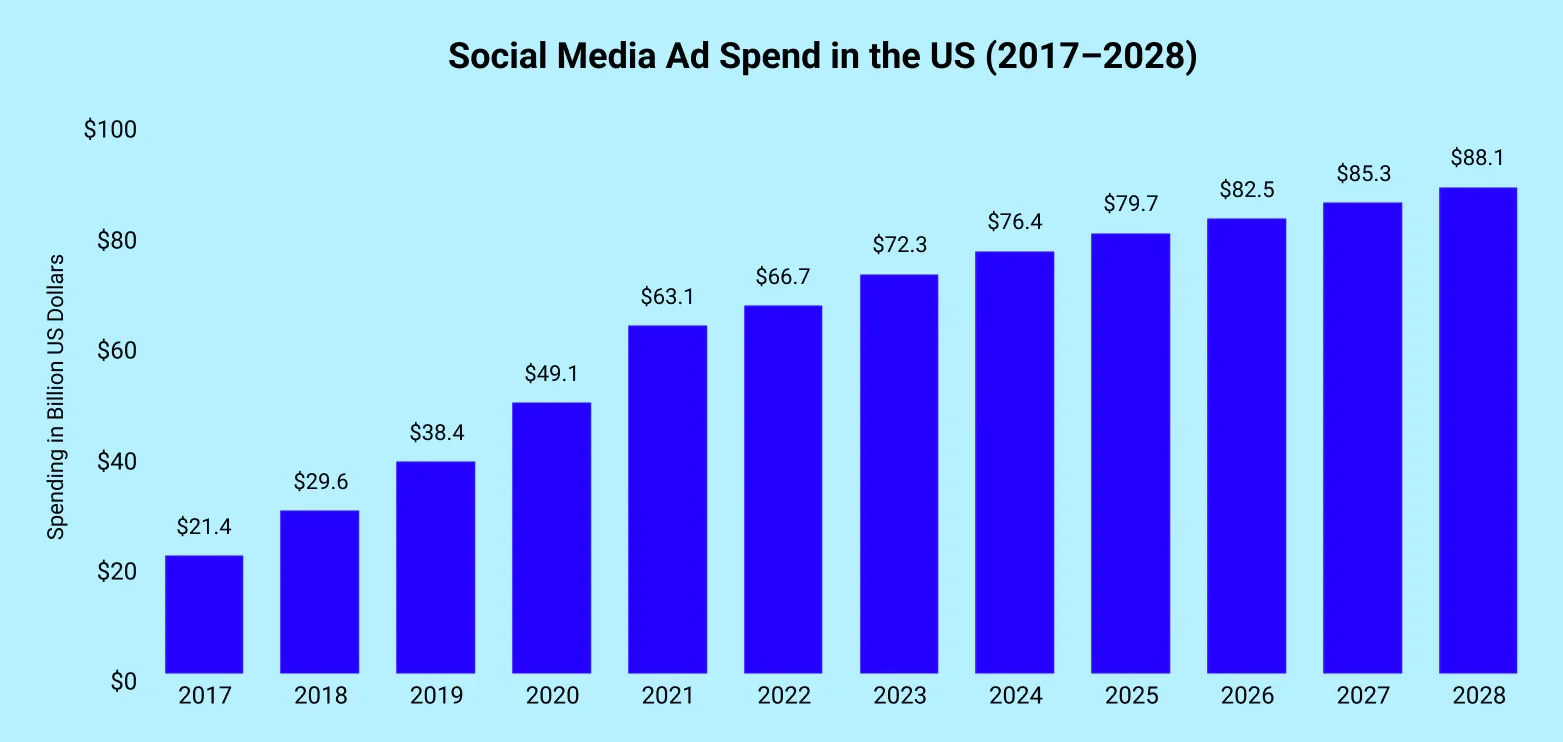
- The ad spending in the United States is expected to show an annual growth rate of 4.3% in 2025 which is resulting in a projected market volume of US $79.7 billion.
- Marketing statistics for social media show that in the year 2022, Facebook’s advertising revenue has surpassed 113 billion U.S dollars.
- By 2021, Instagram ranked as the most used influencer marketing platform used among marketers in the United States. As 68% of marketers uses influencer marketing followed by 52% of marketers over Facebook.
- As per social media influencer statistics, TikTok surpassed YouTube as an influencer marketing platform in the year 2021.
From the data mentioned related to social media platform statistics. It can be stated that if you are wondering to develop one of those apps, you are going to be another billionaire.With tons of marketing through social media apps, marketers and businesses who like to sell their products and service via these platforms can be one of your major clients.
Also Read: Social Media App Monetization Models

Social Media Networks Demographics Based on Regions
Till now, you have gotten through the worldwide market dynamics of the industry, along with social media usage statistics. You have captured the insights related to how social media platforms make money over different marketing channels.
Now, it’s time to narrow down the scope of using these platforms across different regions. Shall we proceed it together?
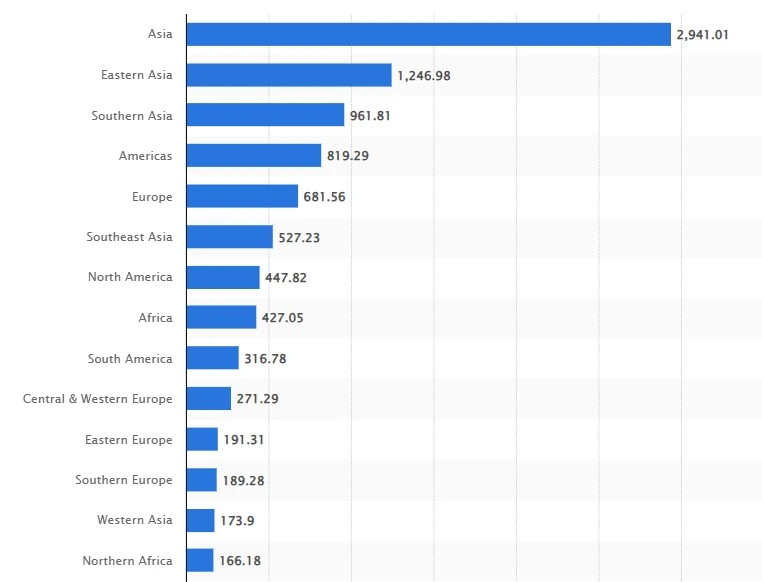
Based on the social media usage statistics by country and region, Eastern Asia accounted for over 1.2 billion social media users. On the other hand, Southern Asia had over 961 million social media users. While 819 million people use the platforms in America and 681 million in Europe.
A) Social Media Usage in the United Kingdom
- In 2023, social media users in the UK stands for about 62 million. The total number of users is expected to reach 65 million by 2027.
- In the UK, social media is a most popular platform among Gen Z and millennials with over 94% reach with both generations.
- The number of social media users in the UK was forecast to increase by 3.2 million users in total between 2024 and 2029. These are continuously increasing over the past years.
B) Social Media Usage in Asia
- In the Asia-Pacific regions, Chinese citizens displayed a strong online presence on these platforms showcasing social media growth statistics.
- The second and third-ranking countries were India and Indonesia, which had 462 and 139 million social media user accounts.
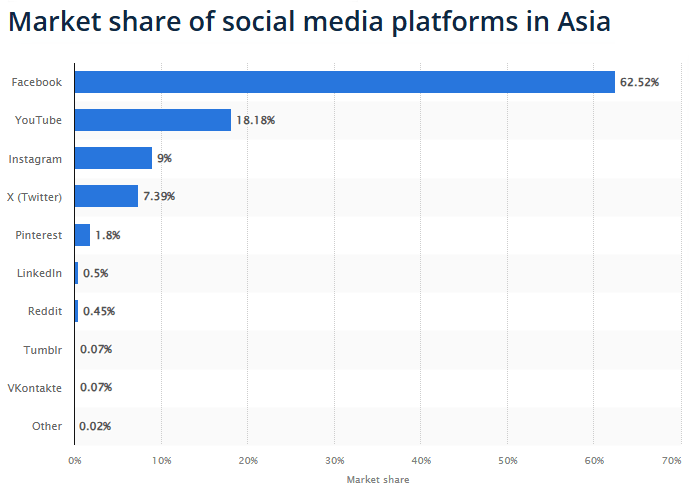
- In October 2024, Facebook has been accounted for nearly 62% of the social media market across Asia.
C) Social Media Usage in Europe
- When it comes to Europe, sending private messages over social media platforms was the most common activity for the people in Germany and France.
- According to social media popularity statistics, Facebook has the largest indicator reach with 470.66 million users however, Tumblr has been ranked last with 9.31 million users.
- In the year 2022, a survey conducted displayed that almost one-third of the millennial and Gen Z users in Europe used social media platforms to cook food while 56% stated that they cooked meals that are trending.
D) Social Media Usage in Africa
- In Northern Africa, around 40.4% of the people are using social media stood at 41.6%. While in central Africa, it was only close to 10% of people.
- The number of social media users are continuously increasing over 384 million in 2022.
- Facebook is one of the leading platforms in Africa in terms of Market Share.
Social Media Penetration Rate Across Countries and Territories
Now, as you cover the social media regions and platform usage across demographics, it’s time to learn the social media penetration rate across diversified countries.
Before that, here’s what penetration refers to” social media penetration rate displays the amount of popularity of the platform across the given country”.
- The highest penetration rate is possessed by UAE with 115%, followed by Saudi Arabia 96.2%, South Korea 93.4%.
- Hong Kong has an 83.9% penetration rate followed by Spain and others.
- In April 2024, Northern and Western Europe are among the regions with the highest penetration rate with 78.7% and 77.1% respectively.
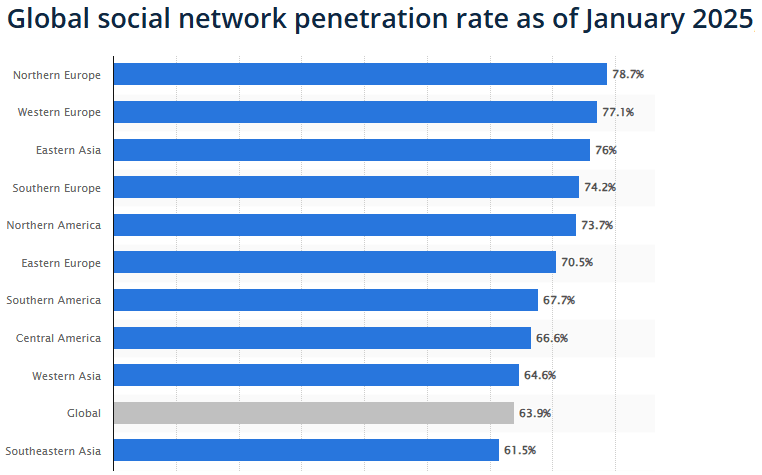
- However, Eastern and Middle Africa have the lowest penetration among all with 11.1% and 10.1% respectively.
Alright, here’s some more to go with the social media statistics report on gender and occupation. Let’s count on them one after the other.
Gender-Wise Usage of Social Media Platforms
Now, as you covered most of the social media stats report, you can view the social media comparison statistics between men and women here.
This section will assist you in identifying the gender distribution market that you need to target for social media app design.
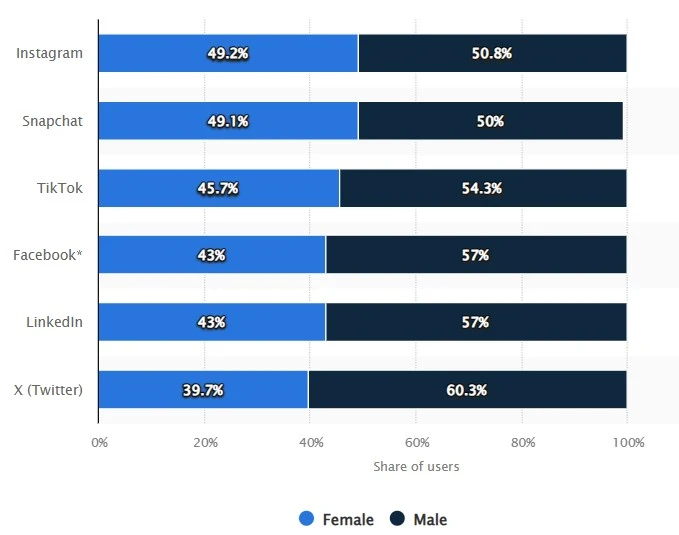
- As from the date of April 2024, 49.2% of the global Instagram audience are women, giving this platform the highest share of female audience mong the selected social media platforms.
- 49.1 % of users are identified as women using the photo-sharing app, Snapchat.
- On the other hand, Twitter (X) was by far the platform with the highest number of male users and has been accounted for 60.3% of its worldwide audience base.
- As of January 2024, 51.2% of the social media users within the United States were women and 48.8% were men
- Based on the September 2023 data, 27% of male in the United States stated that they use Reddit more as compared to 17% of female.
- As per Pew Research, Reddit has been used by more Americans in comparison to women. 64% of women are using Facebook, while only 35% of men are using the platform.
- 56% of men use Twitter rathen than 43% of women.
Demographic Usage of Social Media Platforms
Did you notice from the gender-wise section that women are more inclined towards social media platforms while men get them to have a particular type of information?
Okay! But what about the usage of social media as per different demographics. Let’s have a look at it.
► Teens and Social Media
- TikTok usage is most common among black teens. 8 in every ten black teens which is 81% use TikTok compared to 71% of Hispanic teens.
- About 77% of teens stated that they use YouTube daily and about half of them use Instagram or Snapchat once a day.
- Facebook usage among teens has been dropped from 71% in 2014-15 to 32% in 2022. Twitter and Tumblr have also experienced declines among teens.
- As per Gen Z social media statistics 54% of teens stated that it would be difficult for them to give up social media.
- 90% of teens aged between 13 and 17 have used social media.
► Usage of Social Media among Businesses
- 76% of local businesses use social media platforms as one of the important parts of their marketing strategy.
- Although 41% of them rely on social media to drive revenue as per social media statistics for business.
- 97% of Fortune 500 companies are totally dependent on social media for marketing and more than 50 million small businesses make the use of Facebook to connect with customers.
- Based on b2b social media statistics reports, 25% of B2C and 15% B2B respondents stated that they use Instagram for business.
► Workplace and the Social Media
- 34% of workers use social media to take a mental break from work. However, 27% use it to remain connected with friends and family while at work.
- 17% of workers use social media to learn about their colleagues at work.
- Younger workers use social media channels to find information on social media that has improved their opinion of a coworker.
- Moreover, workers whose employers have an at-work policy of using social media are less likely to use the platform for their personal reasons while on the job.
Now, as we are proceeding towards studying the time horizons of using social media, you should know how much you are engaged with it.
Give it a think- How many times did you use social media platforms in a day?social media statistic

Time Statistics: How Much Time Users Spent Over Social Media?
Once got a message and we sneek to our phones. Aren’t we?
Then we dodge other social media apps and realise that we have lost almost a couple of minutes, sometimes even hours of scorlling the feed.
Well, this is how social media platforms are built. They are full of content to engage us. Let’s have a peek at social media engagement statistics to know the time spent over using such platforms.
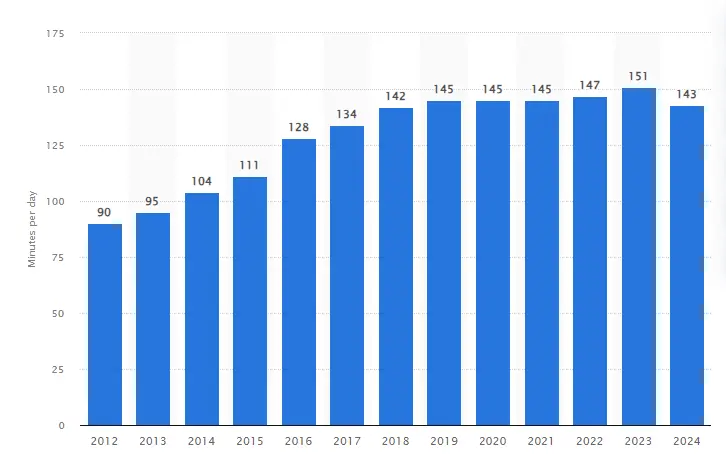
- In 2024, the average daily social media usage of internet users worldwide is 143 minutes per day which has decreased by 151 minutes from the previous year.
- In Brazil, online users spend an average of three hours and 49 minutes on social media each day.
- On the other hand, social media app statistics revealed that the daily time spent on these social media platforms in the U.S was just two hours and 16 minutes.
- Based on a survey over research, it has been identified that more than 82% of respondents spent at least an hour per day over social media while at work.
- Moreover, research from GWI displays that a social media user now spends 2 hours and 23 minutes per day over these platforms.
Social Media Addiction and Mental Health Statistics
We are not here to provide you only the bright side of social media but also the dark one.
Till now, we have examined that teenagers are the ones using social media more often than adults and they are addicted to using it more. Let’s learn about social media addiction and mental health statistics.
- Based on the article of BMC psychology, the excessive usage of social media has created tremendous stress, and pressure and has increased sadness as well as isolation.
- Based on the survey started in the United States, 47% of millennials use social media.
- On the other hand, generation X stated that social media harms the mental health.
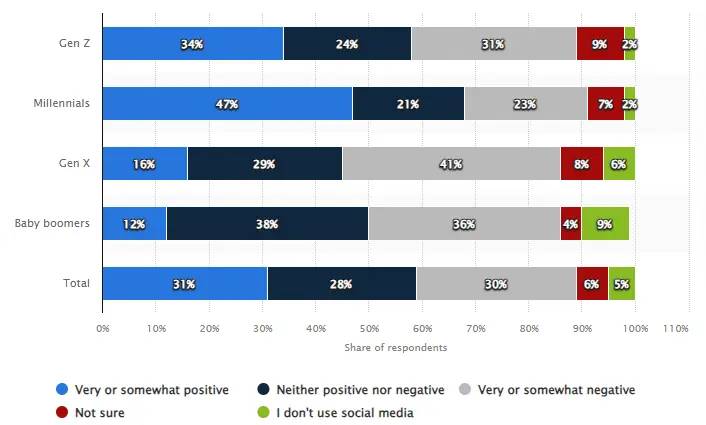
- As per the March 2024, survey, it was reported that 32% of adults feel that social media either has a positive or negative impact on their mental health.
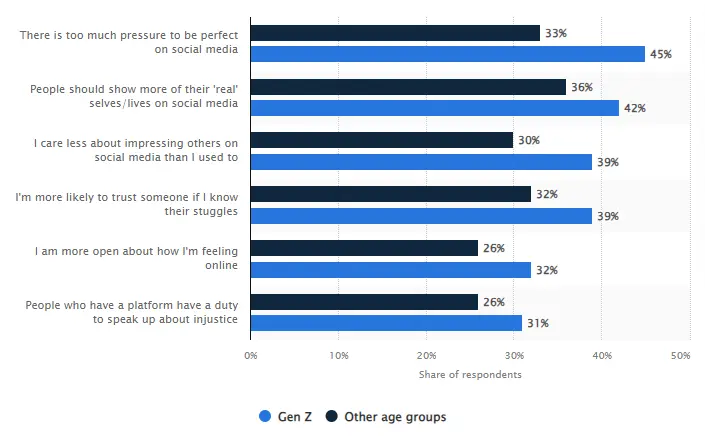
- As per the online survey conducted in the United States, in 2021 45% of Gen Z respondents stated that there was too much pressure to be perfect over platforms, while only 33% of the other age groups agreed with the social media facts.
Choose Nimble AppGenie to Standout Competition
Now that you are completely aware of the social media consumption statistics, it’s time to apply them for yourself and use the data for enhancing your app presence.
Well, to improve your existence over the other competitors, you need a team to help you.
Nimble AppGenie is the best social media app development company focused on achieving targets by studying current market statistics.
We are passionate about converting your social media app dream into reality by adding all the essential elements that can take you so far to stand out competition.
Conclusion
The evolution of social media has become a revolution not only for the users of the app but also for businesses to directly connect with their customers. Approx 5 billion people are using social media and this number is projected to reach over six billion in 2028.
Social media statistics worldwide display that 58.8% of people stated that they use social media platforms to remain connected with their friends and family. Facebook was the first platform that has surpassed 1 million users and currently has 3 billion active social media users.
The highest social media penetration rate was found in UAE and China is one of the largest countries where most of the people are on social media platforms. 34% of workers use social media at work to take a break and the average time spent over the platforms is 143 minutes per day.
However, the government is keen on reducing the negative impact of social media on the mental health of the users.
FAQs
As of 2024, over 5 billion people are using social media apps, with this number projected to exceed 6 billion by 2028.
Facebook is one of the most popular social media apps with about 3.06 billion monthly active users and is followed by WhatsApp with 2.78 billion users.
Social media app statistics provide crucial insights into user behavior, market trends, and platform performance. These statistics help developers, marketers, and businesses understand the current landscape, make informed decisions, and optimize strategies.
Social media has evolved significantly since its early days in the 1970s with the PLATO system. It progressed through bulletin board systems in the 1980s, the first social networking sites like Classmates.com and SixDegrees in the late 1990s, major breakthrough was identified when Facebook arrived in 2004.
Facebook leads with over 3 billion monthly active users, followed by YouTube with 2.5 billion, and Instagram with 2 billion. Other significant platforms include WhatsApp, LinkedIn, and Snapchat, each with hundreds of millions of active users.
Social media platforms primarily generate revenue through advertising. In 2024, global spending on social media advertising is expected to reach $219.8 billion, with an annual growth rate projected to increase this to $255.8 billion by 2028. Platforms like Facebook and Instagram also leverage influencer marketing to boost their revenue.
Social media can have both positive and negative impacts on mental health. Studies indicate that 59% of people report that social media affects their mental health, with higher pressure observed among younger users to maintain a perfect online persona.
Eastern Asia has the highest number of social media users, followed by Southern Asia and the Americas. In terms of gender, platforms like Instagram and Snapchat have a higher percentage of female users.

Niketan Sharma is the CTO of Nimble AppGenie, a prominent website and mobile app development company in the USA that is delivering excellence with a commitment to boosting business growth & maximizing customer satisfaction. He is a highly motivated individual who helps SMEs and startups grow in this dynamic market with the latest technology and innovation.
Table of Contents
No Comments
Comments are closed.